Mostly Cloudy, 81° F

Excluding registered and practical nurses, physical therapists (PTs) consistently rank among the top five largest healthcare occupations that require licensure in the United States. The number of PTs increases each year, as does the American population, including a growing number of aging adults who are more likely to need physical therapy. Becoming a PT requires extensive education, resulting in a doctoral or professional degree, making it a lengthy and expensive process to enter the profession. Once new PTs graduate and become licensed, they want to know they have plenty of employment options in their desired locations.
While physical therapist demand continues to grow nationwide, the number of PTs available to serve patients isn't evenly distributed among states, with some states having a higher need than others. Vivian Health examined the numbers to determine which states employ the most PTs — and where demand might outpace supply — to provide a comprehensive breakdown of which states need physical therapists the most.
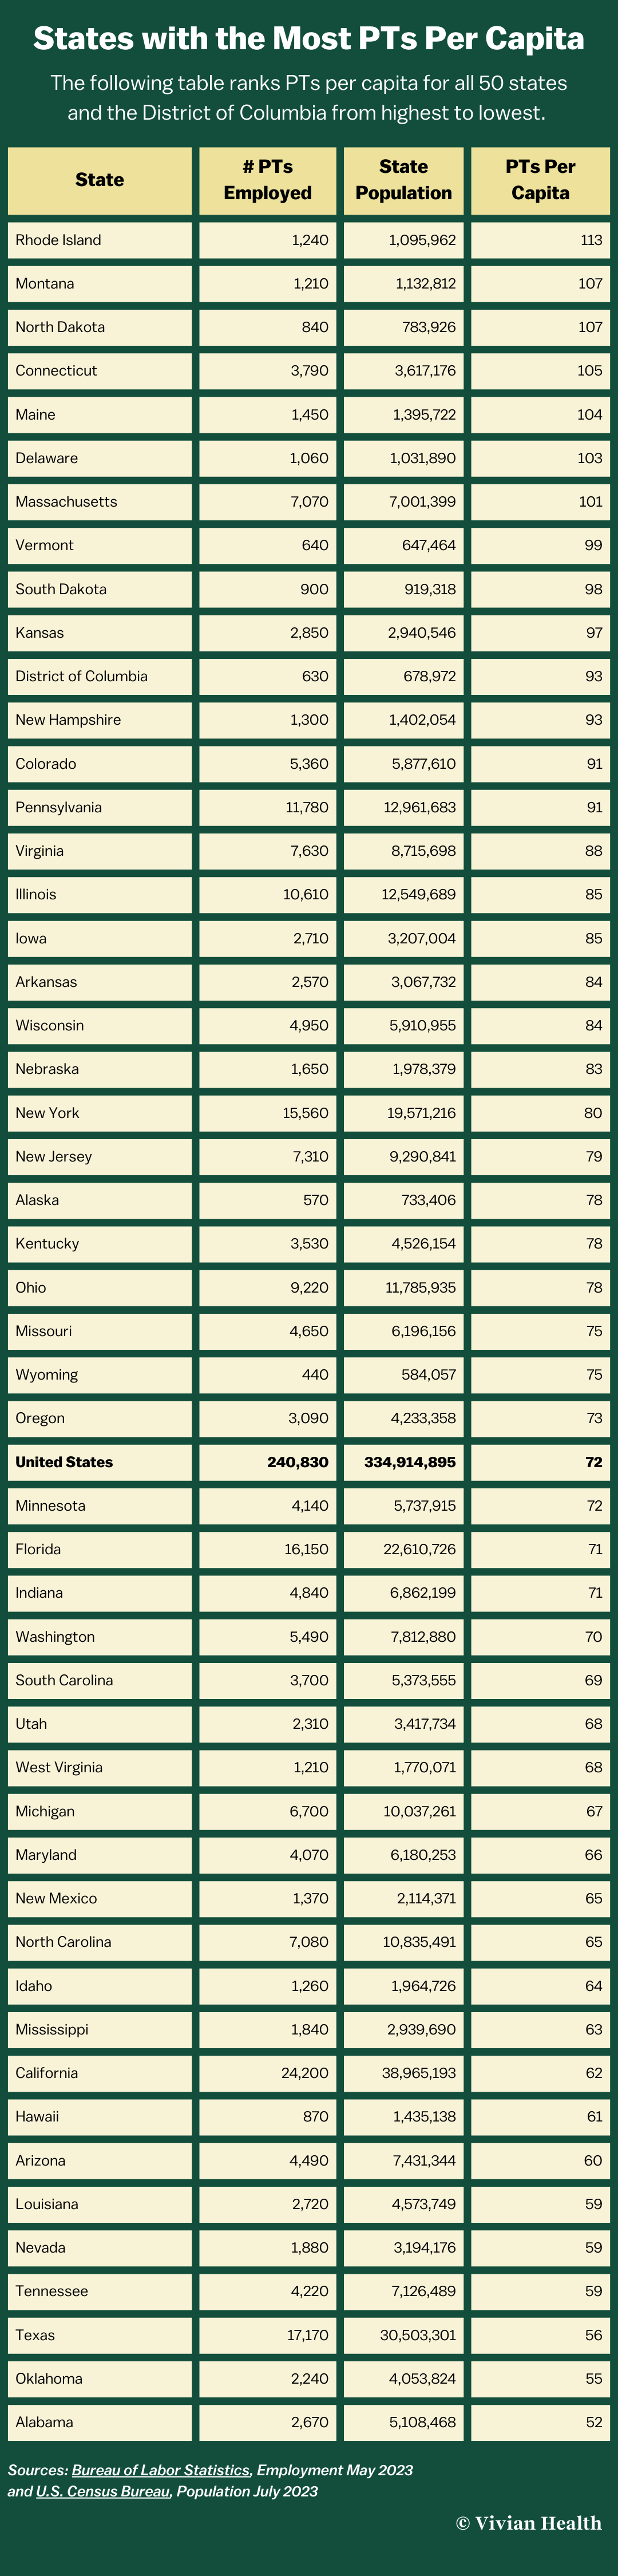
To help determine where demand might be higher, Vivian Health took the population of each state based on U.S. Census Bureau data from July 1, 2023, and divided it by 100,000. Then, the number of PTs employed in each state based on data from the Bureau of Labor Statistics (BLS) in May 2023 was divided by the first result to determine PTs per capita. In this equation, per capita equals the number of PTs available per 100,000 people. This number reveals which states have more PTs to serve their population and which are lacking.
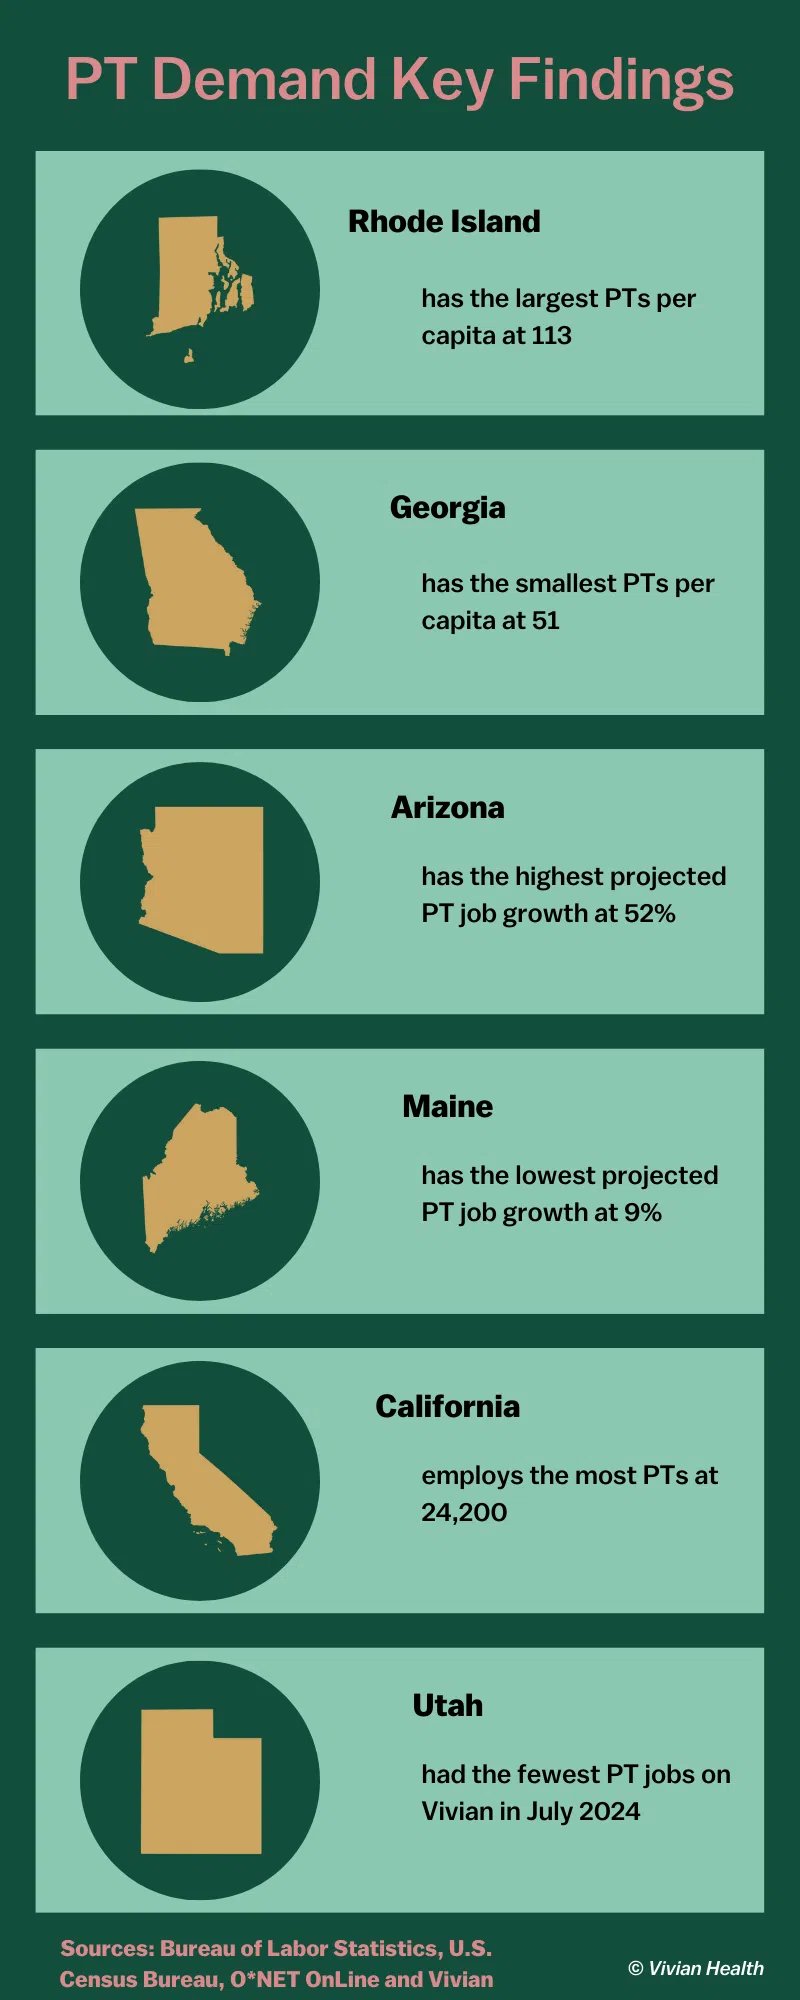
From this data, it was determined that the number of PTs per capita nationally was 72 per 100,000 people, which had risen from the 65 reported by the American Physical Therapy Association (APTA) in 2017. However, many states have a per capita of PTs well below the national average while others are well above. Rhode Island has the most abundant PTs per capita at 113 per 100,000 people, while Georgia has the least amount at 51. Based on this logic, states with fewer PTs per capita may have a higher demand than those with a better distribution of physical therapists.
As you can see from this table, the three states with the highest employment of PTs include California at 24,200, Texas at 17,170 and Florida at 16,150. Although having a significant number of PTs employed may indicate that the field is already saturated, these three states also have the highest populations. So, despite having a large pool of PTs employed, they each have a lower-than-average per capita at 62, 56 and 71, respectively.
The BLS projects that physical therapist demand will increase by 15% between 2022 and 2032 nationwide. The BLS also estimates an average of about 13,900 job openings for PTs each year over this decade. Like the skewed distribution of PTs to serve each state's population, the projected employment growth for PTs also greatly varies by state.
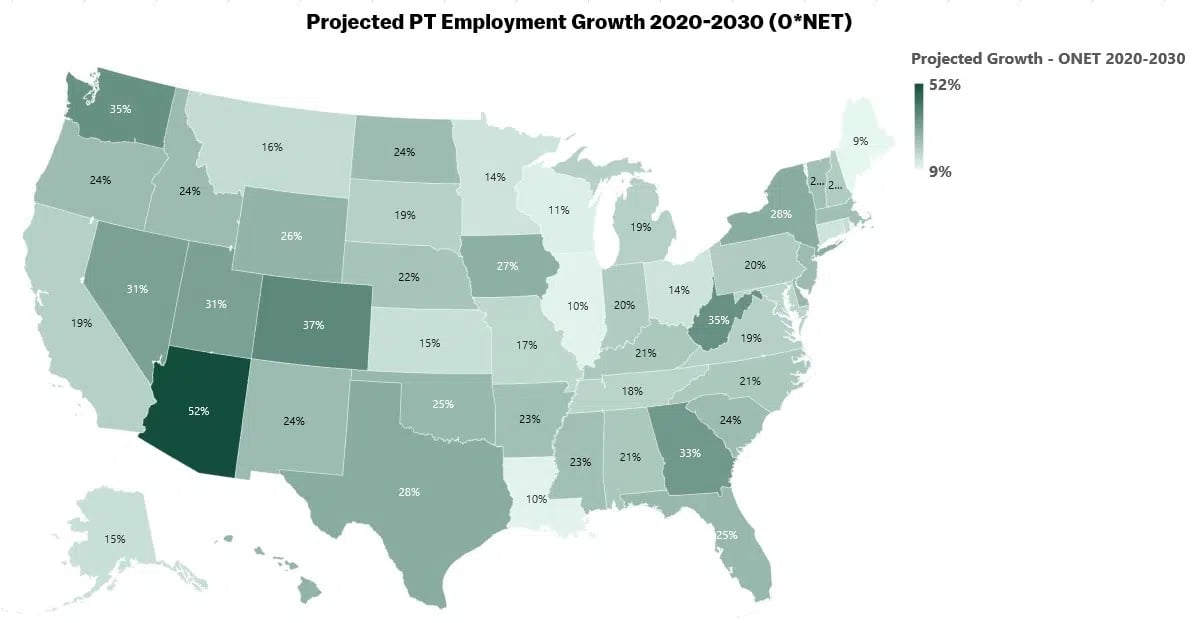
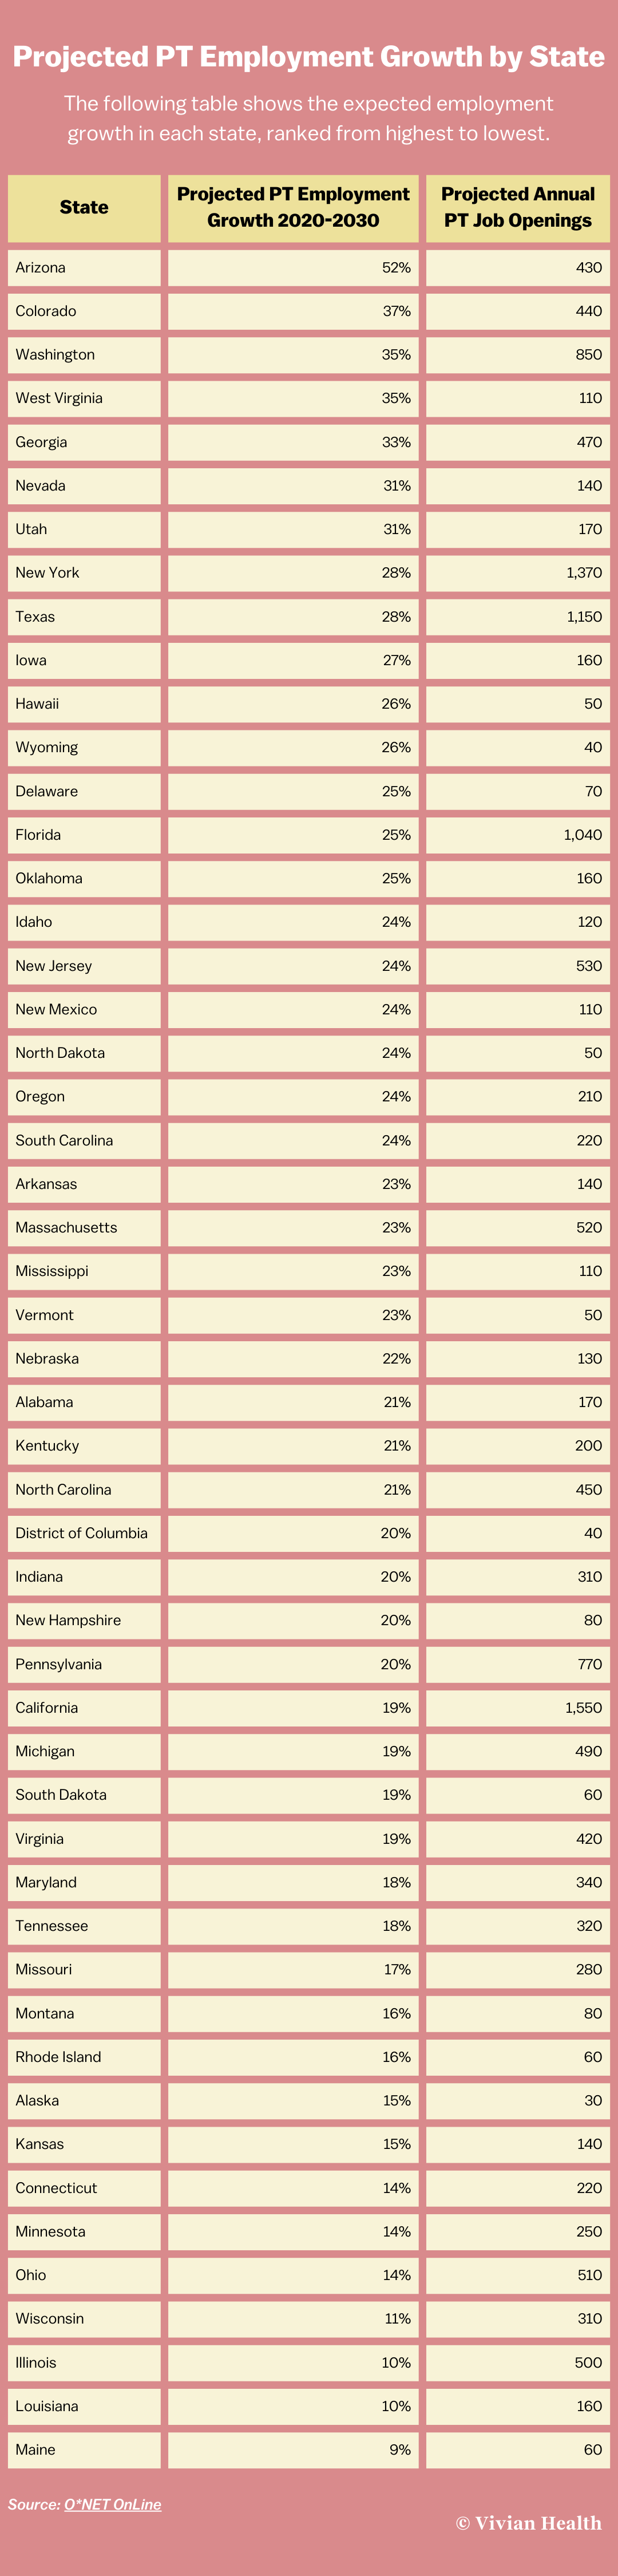
Because the BLS doesn't provide a breakdown of increased demand by state, Vivian Health turned to O*NET OnLine, a site maintained by the National Center for O*NET Development, on behalf of the U.S. Department of Labor, Employment and Training Administration. Its data is slightly behind the BLS, so state data runs through the decade of 2020-2030.
O*NET predicts that Arizona will have the most significant growth in PT employment during this decade at 52% and Maine the smallest at only 9%.
With increased demand often comes shortages, or worsening shortages, in some cases. Between 2021 and 2036, the National Center for Health Workforce Analysis (NCHWA), a division within the Bureau of Health Workforce at the Health Resources and Services Administration, projects a shortage of 6,510 physical therapists nationwide. Within this 15-year period, it expects supply to increase by 17% but demand for physical therapists to increase by 18%. Added to the previous deficit, it results in a 2% deficit overall.
A 2023 report from the APTA indicates that outpatient clinics are having an especially difficult time with PT staffing shortages, though it has shown improvement. It stated that the total vacancy rate averaged 10% in mid-2023, as reported by practices. These rates included physical therapy assistants (PTAs) at 12%, PTs at 11% and support personnel at 8%.
While the overall vacancy rate dropped from 17% in 2022, the ongoing staffing issues remain taxing for many PT practices. Nearly 40% of practices said they had the same number of staff openings in 2023 as the previous year within their clinics, and almost half of this number reported an increase in openings of 50% or more. With 9,809 PTs employed in outpatient clinics in 2023, the deficit still amounted to 1,253, with 1 in every 3 clinics having an opening for a PT nationwide.
The report didn't include a state-by-state breakdown, but the APTA reported that clinics in the West had the highest vacancy rates at 16.7%, with those in the South not far behind at 15.2%. Vacancy rates dropped to 11.1% in the Northeast, and the Midwest had the lowest rate at 7.6%. Surprisingly, small practices felt less impact from vacancies than larger ones.
The uneven distribution of PTs across the country can significantly hamper access to essential physical therapy services. While patients can easily obtain care in regions with a high concentration of PTs, residents in underserved areas where PTs are scarce may face long wait times or need to travel great distances to receive care. This limited access could delay treatment, exacerbating injuries or conditions that timely intervention could have managed more effectively.
Because major metropolitan areas tend to have a high concentration of physical therapists, shortages are often particularly acute in rural areas. The resulting healthcare disparities are also particularly concerning in economically disadvantaged regions, where the lack of PTs may contribute to higher rates of chronic pain, disability, prolonged hospital stays and dependence on addictive prescription painkillers.
The five metro areas with the highest concentration of PTs employed per the BLS are also among the top 10 in population and include:
Like most healthcare fields, the BLS reports that demand for physical therapists comes partly from the large number of aging baby boomers. While older adults within this generation are staying more active than previous ones, aging adults are still more likely to experience mobility-related injuries, surgeries and medical issues that require rehabilitation through physical therapy.
The National Association of Rehabilitation Providers and Agencies pointed out that another significant reason why there's a PT shortage is many physical therapists are experiencing burnout, like other healthcare professionals. Long and constantly changing hours have caused burnout to increase among physical therapists, leading many to either switch to part-time positions or quit the profession altogether. Many PTs also felt additional post-pandemic stress that made it challenging to establish a satisfactory work-life balance and struggle to remain motivated to continue practicing.
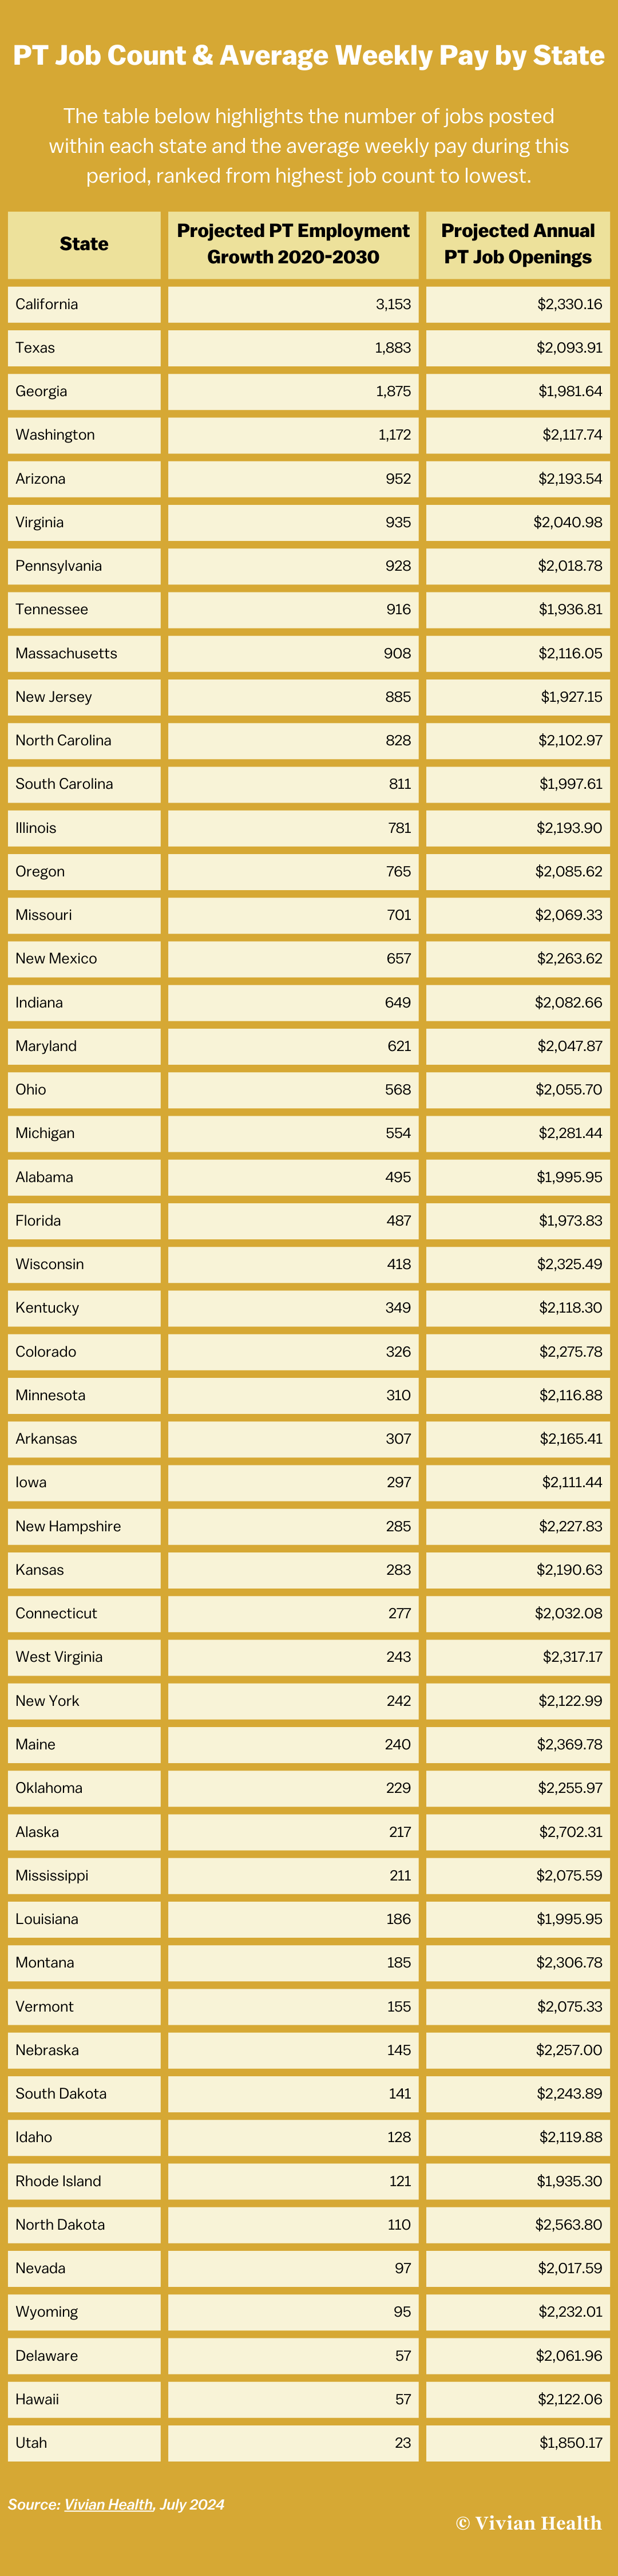
including likely shortage areas. To cap these details, Vivian Health covered job counts and pay so PTs can make informed career decisions. The BLS states that the national average salary for PTs was $99,710 yearly or $47.94 hourly in May 2023.
Over the past 12 months, 158,503 PT jobs have been posted on Vivian Health's jobs marketplace. According to proprietary salary data, the average weekly wage for PTs was $2,127.98 based on all jobs posted on our site during July 2024, the most recent complete month of data available.
Whether you're looking to relocate or simply want to understand the market better, knowing which states have the highest demand for physical therapists and offer competitive salaries can help you make strategic career decisions. The right move could enhance your professional growth and ensure you're making a meaningful impact in the communities that need your expertise the most.
This story was produced by Vivian Health and reviewed and distributed by Stacker Media.


