Clear, 52° F
U.S. drivers spend more time on the road than motorists in other parts of the world. In 2022, Americans consumed over 184 billion gallons of motor fuel, but that number was not evenly distributed across all states. Drivers in some states pump thousands of gallons of gas more into their vehicles each year than those in others, and some states see dramatically less fuel use at the pump relative to their driving population.
There are many reasons why some drivers use more gas than others. One of them is that some states have access to more options for residents to get around without driving. Individuals who walk, bike or use public transit to commute or travel consume less fuel than if they had driven to their destination.
Taking transit can also impact consumers' wallets beyond what they pay at the pump. Riding public transportation could save consumers over $13,000 a year on purchasing, financing and refueling a car.
"It's simple: When you take transit, you save on gas," a Federal Transit Administration (FTA) spokesperson told ConsumerAffairs. "More public transit access for Americans means a more energy-independent country and families able to invest more in health care, leisure time, groceries and other important priorities."
The ConsumerAffairs Research Team analyzed data on motor fuel use and licensed drivers from the Federal Highway Administration's (FHWA) 2022 highway statistics to rank the 10 states where drivers use the most (and least) gas.Commuting trends in each state were also examined to determine why some drivers have to refill their tanks more often than others. The scores reflect the number of gallons of motor fuel used per average driver in each state in 2022.
Washington's score: 221 gallons consumed per driver
Before diving into the top 10 and bottom 10 lists, Washington, D.C. deserves a special mention because of how little gas its drivers consume compared with those in the states. In 2022, the average driver in the capital used around 221 gallons of gas. That was less than half the fuel used by motorists in all other states during the same period.
Many Washington residents travel by means other than driving, with less than a third of residents commuting to work by car. The nation's capital had more residents who walked to work, cycled to their jobs or worked from home than in any other state in 2022. With the option to catch a commuter train or ride the Metro, public transit is also popular in the nation's capital.
The states where motorists pump more gas tend to be more rural and have fewer alternative transit options to get them to their destination. Not everyone drives in these states, but most do. Many also drive trucks, which are less fuel-efficient than other motor vehicles.
The following ranking was calculated by analyzing the amount of motor fuel consumed in each state in 2022 and cross-referencing the data with the number of registered drivers.
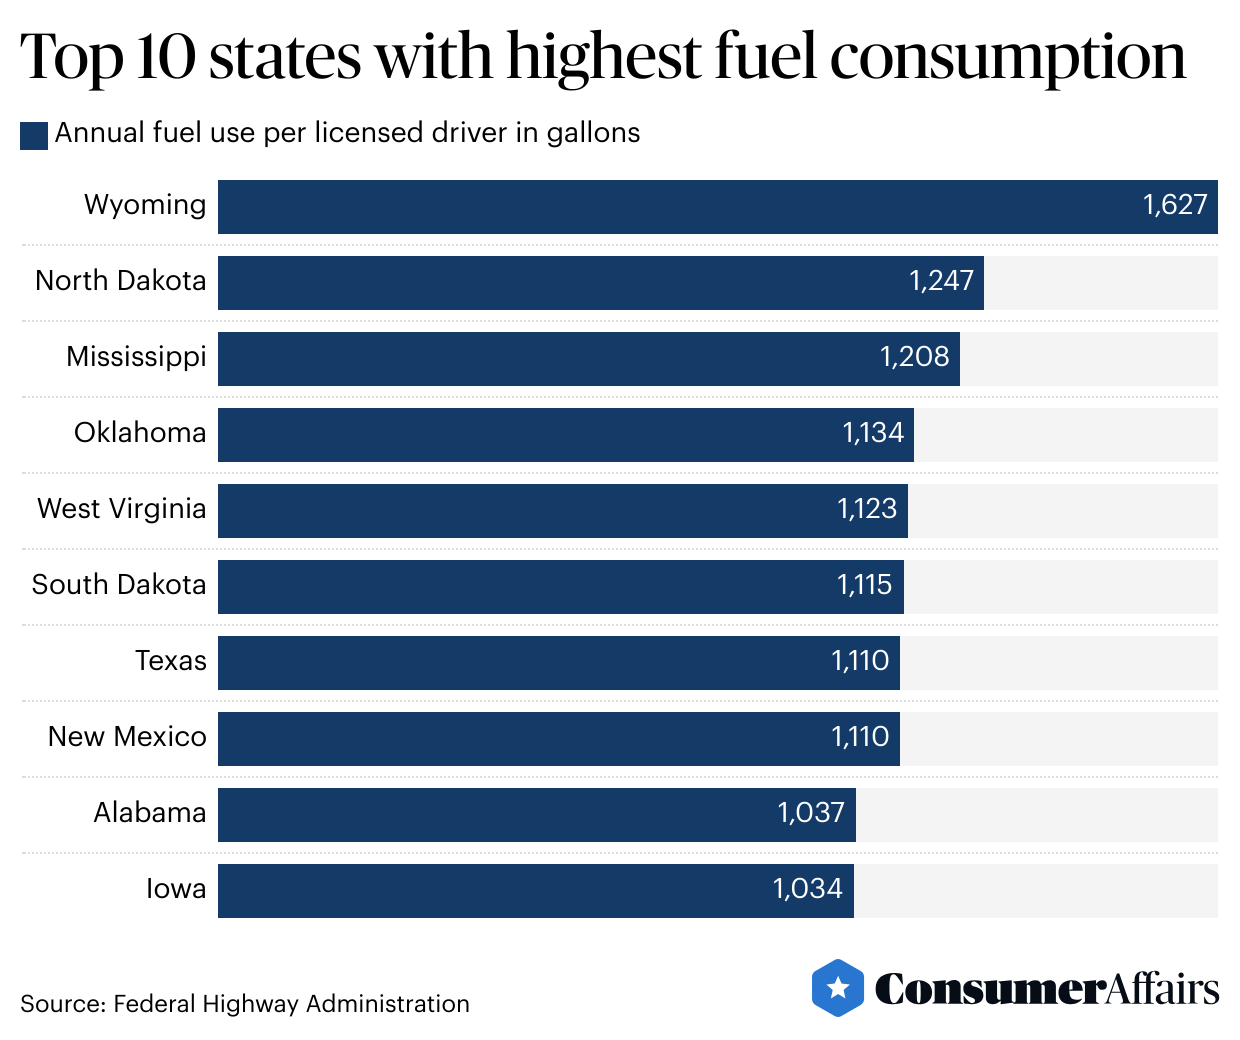
1. Wyoming
Wyoming's score: 1,627 gallons of gas per driver
In 2022, more than 80% of commuter trips in Wyoming involved a car. The state had the most vehicle miles of travel, and trucks were a popular option. Nearly one-fifth of miles traveled in rural parts of the state were completed via truck, which ranked Wyoming second in the nation for truck miles driven.
Some cities and towns, including Casper and Cheyenne, offer limited bus route service, but public transit in Wyoming made up less than 1% of commutes. The state is also one of two in the mainland U.S. that lack intercity or interstate passenger rail service through Amtrak.
2. North Dakota
North Dakota's score: 1,247 gallons of gas per driver
North Dakota has access to Amtrak passenger rail service, and some cities, like Fargo, have historically had more than 1 million residents opt to ride the bus each year, according to the National Transit Database.
However, driving a fuel-powered vehicle still accounted for the vast majority of work commutes in the state in 2022, with just under 20% of those miles driven with gas-guzzling trucks. Gasoline was taxed in the state at 23 cents per gallon that year.
3. Mississippi
Mississippi's score: 1,208 gallons of gas per driver
Several factors push Mississippi toward the top of the ranking of the states with the most gas-guzzling drivers. More than 90% of residents in the state commuted to work by motor vehicle in 2022, and the state had the highest percentage of commuters who drove alone to work. It also had the lowest percentage of commuters who worked at home and ranked fourth in the total number of miles traveled in a vehicle. With a gasoline tax of 18.4 cents a gallon in 2022, Mississippi had one of the lowest rates in the nation.
Transit agencies in Jackson, Gulfport and Biloxi have served hundreds of thousands of riders each year, and passenger rail connects Mississippians to neighboring Tennessee, Louisiana and farther destinations. With part of the state bordering Memphis, residents may also use less gas if they ride bus routes during trips to the city.
4. Oklahoma
Oklahoma's score: 1,134 gallons of gas per driver
In 2022, about 90% of Oklahomans' commutes were by car, and the state's fuel tax rate was 20 cents per gallon.
In some years, buses in Oklahoma City and Tulsa have recorded more than 3 million riders. Amtrak runs one train service route through the state, but motor vehicle travel has largely been the most popular way of getting around.
5. West Virginia
West Virginia's score: 1,123 gallons of gas per driver
West Virginia is ranked at the lower end of the country in terms of vehicle miles traveled, yet more than 85% of work commutes in the state were by car in 2022. The state had a fairly high fuel tax rate of 35.7 cents per gallon that year, and close to 14% of vehicle miles traveled were by truck.
Bus routes in Parkersburg, Huntington, Wheeling and Charleston serve millions of riders each year, but public transit still accounts for less than 1% of work commutes.
6. South Dakota
South Dakota's score: 1,115 gallons of gas per driver
While Rapid City and Sioux Falls transit services serve hundreds of thousands of riders yearly, over 80% of work commutes in 2022 were taken by car in South Dakota. Like Wyoming, South Dakota has no intercity rail service, and Amtrak has no active plans to bring trains into the state.
7. Texas
Texas' score: 1,110 gallons of gas per driver
While cities across the Lone Star State offer bus, passenger rail and limited rapid transit services that attract tens of millions of riders per year, public transit accounted for less than 1% of travel to and from work in 2022. Driving alone and carpooling accounted for more than 80% of commuter trips.
In sheer quantity, Texans used 20.8 billion gallons of motor fuel in 2022, the most of any state. That year, the state also had one of the lowest fuel tax rates, at 20 cents per gallon.
8. New Mexico
New Mexico's score: 1,110 gallons of gas per driver
By a very fine margin, New Mexico falls just below Texas on the ranking of the top 10 most gas-guzzling states. In 2022, more than 80% of work commutes were taken by car within the state, and it was ranked seventh for vehicle miles traveled. Its gasoline tax rate was the fourth-lowest in the nation that year, at 17 cents a gallon.
In some years, buses in Albuquerque have seen over 10 million riders, and Santa Fe buses have served more than 1 million riders some years. The state's Rail Runner Express commuter service also runs trains across several cities, spanning nearly 100 miles, and two Amtrak routes connect residents to neighboring states.
9. Alabama
Alabama's score: 1,037 gallons of gas per driver
In 2022, Alabama drivers traveled the second-highest number of miles per capita in the country. Nearly 90% of work commutes were taken by car.
Ridership on buses in Birmingham hovered around 3 million riders before the pandemic and above 1 million in more recent years. Buses have attracted hundreds of thousands of riders in cities like Mobile, Montgomery and Huntsville.
10. Iowa
Iowa's score: 1,034 gallons of gas per driver
In 2022, more than 80% of commutes in Iowa were by car, and about 15% of the miles driven in the state were in a truck.
Millions of riders have hopped on bus routes in multiple cities in the state, including Iowa City, Davenport, Des Moines and Ames. Iowa also offers Amtrak service from one route out of Chicago, but the company is exploring a second route with service into the Quad Cities.
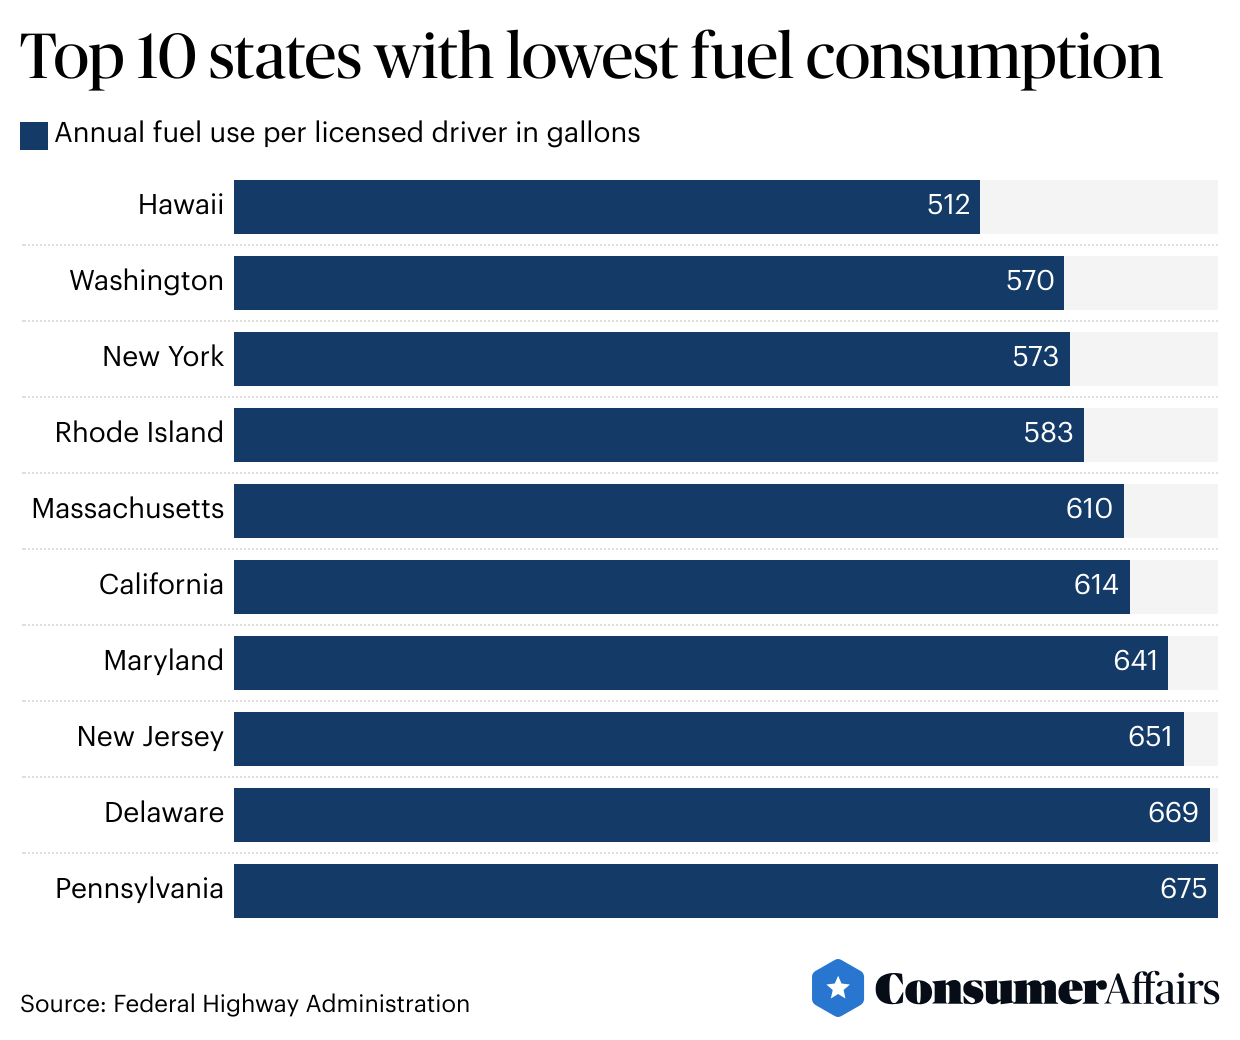
Unlike many states that consume the most motor fuel, the states in ConsumerAffairs' list tracking the lowest fuel consumption often support more robust public transit options and other incentives to avoid high fuel use. These and other factors save hundreds of gallons of fuel yearly per driver, on average, compared with drivers in states in the top 10 ranking.
1. Hawaii
Hawaii's score: 512 gallons of gas per driver
In 2022, driving and carpooling still made up 80% of commutes in Hawaii, and the state had the third-lowest fuel tax rate, at 16 cents per gallon. However, the state ranks close to the bottom in actual miles traveled in a vehicle per capita, perhaps because drivers do not have to drive as far for trips on the islands.
Public transportation made up about 4% of travel to and from work in 2022, and an even larger proportion of commuters either walked to their jobs or worked from home. Annual bus ridership in Honolulu has ranged between 30 and 70 million passenger trips over the years, and buses on Maui have also served millions of riders. A rapid transit train line segment began operating in Honolulu last year.
2. Washington
Washington's score: 570 gallons of gas per driver
About 70% of 2022 commutes in Washington involved taking a private motor vehicle to work, one of the lowest rates in the country. The state had the third-highest fuel tax in the U.S., at 49.4 cents per gallon. Around 20% of residents worked at home, and around 3% took public transit or walked to their jobs.
The Seattle area is the state's primary driver of transit trips, with buses, ferries, commuter trains and a growing light rail system serving millions of riders. Spokane, Olympia and other cities also serve millions of riders per year. Multiple Amtrak routes connect Washington for short- and long-distance trips.
3. New York
New York's score: 573 gallons of gas per driver
New York City's Metropolitan Transportation Authority is the largest transit agency in the U.S. and serves the most riders out of any other provider in the country. Despite experiencing drops in ridership throughout the pandemic, the MTA reported more than a billion trips on the subway in 2022.
Commuter rail routes take riders to Long Island and to and from New Jersey, and multiple intercity Amtrak services converge in the state. Other cities in the state have also seen millions of riders each year. Those options contributed to a 21% rate of commutes by public transit in 2022, with a fair number of workers also walking or biking to work.
However, New York still consumes a lot of motor fuel, with more than 50% of work commutes involving a vehicle. Drivers heading into Manhattan use much of that fuel, but that trend could change because officials are planning to institute congestion pricing and charge many passengers a $15 toll for each drive into the area during peak periods.
4. Rhode Island
Rhode Island's score: 583 gallons of gas per driver
Driving to work made up about 80% of 2022 commutes in the nation's smallest state. Many Rhode Islanders worked from home, and public transportation made up about 1% of travel to work. Fuel taxes were high in 2022, at 35 cents a gallon.
Rhode Island has the third-lowest number of vehicle miles traveled per capita among all states. Millions ride buses in Providence, and intercity rail service connects the state to the rest of New England.
5. Massachusetts
Massachusetts' score: 610 gallons of gas per driver
In 2022, driving a motor vehicle represented under 70% of commutes in Massachusetts. About 4% of workers walked to their jobs, and a greater proportion took public transportation.
Boston's buses have historically served over 100 million riders per year, and millions more ride on the T network and commuter trains that reach the suburbs.
6. California
California's score: 614 gallons of gas per driver
With 16 billion gallons of gas consumed in 2022, California used more motor fuel than every other state except Texas. Car commutes made up just over 70% of work travel that year, with nearly 3% of workers taking public transit and less than a fifth working from home. Gas prices run high in the state, and the gas tax was among the highest in the country in 2022, at 53.9 cents a gallon.
San Francisco has historically led transit ridership in California, with the Bay Area Rapid Transit subway, commuter trains, streetcars and buses serving millions of passengers. However, ridership has struggled to recover amid a post-pandemic slump. Many other cities, from San Diego to Los Angeles, also serve tens of millions of riders with bus and train service.
7. Maryland
Maryland's score: 641 gallons of gas per driver
Driving a private vehicle made up more than 70% of commutes in Maryland in 2022, with only 4% of trips to work being taken via public transit. The state had one of the highest fuel tax rates in the country that year, at 42.7 cents a gallon. About 6% of the vehicle miles driven in the state were in a truck.
Buses and trains in Baltimore have served millions of riders each year, and Amtrak offers intercity service to Philadelphia and Washington, D.C. Parts of the capital's Metro network also connect to Maryland suburbs.
8. New Jersey
New Jersey's score: 651 gallons of gas per driver
Around 70% of New Jersey commuters took a car to work in 2022, but the state had the third-highest percentage of commuters taking public transportation. Those riders benefit from the state's proximity to train services connecting to New York City and Philadelphia. Trains and buses around Jersey City have seen millions of passengers each year.
9. Delaware
Delaware's score: 669 gallons of gas per driver
In 2022, about 80% of work commutes in Delaware were taken by car, and another 15% of the state worked from home. Public transit made up a little over 1% of trips to work.
Millions of riders take buses across the state, and Amtrak service connects Wilmington to major hubs like Baltimore and Washington, D.C.
10. Pennsylvania
Pennsylvania's score: 675 gallons of gas per driver
Pennsylvanians paid a premium at the pump in 2022 due to having the highest state gas tax rate, at 57.6 cents per gallon. Driving amounted to around 70% of work commutes, and public transportation made up 3% of trips to work.
Trains and buses in Pittsburgh serve tens of millions of riders each year, and millions take advantage of service in Philadelphia. Multiple Amtrak routes converge in both cities.
Transportation is one of the biggest expenses for American households, and fuel use is one way to determine where transportation expenses may be higher. FHWA statistics show that states where drivers use more gas have fewer public transit options and, in turn, see less ridership on bus and train services. That means more of residents' money tends to go toward purchasing a vehicle and paying for gas, insurance, oil changes, part replacements and other regular maintenance.
Data from the Bureau of Labor Statistics indicates that households spent an average of $5,645 in 2022 on costs related to owning and operating a motor vehicle. That same year, the average public transit fare was $2.48, according to the National Transit Database.
If an employee took public transit to and from work every day and took two weeks of vacation in 2022, they would have spent an average of $620 on work-related transportation costs — thousands of dollars less than using a private motor vehicle.
"A household with access to transit has the potential to save substantially on transportation costs," an FTA spokesperson told ConsumerAffairs. "Even if the transit-accessible household also owned a car, they could still experience a large portion of these savings through replacing their daily automobile travel with transit."
Though taking public transportation may not be as fast a travel option as driving in many states, having more robust transit networks can reduce fuel use, potentially cutting expenses and bolstering consumers' finances. Those looking to save money should consider all their transportation options and associated costs.
ConsumerAffairs' state rankings utilized 2022 data from the Federal Highway Administration to determine the amount of gasoline consumed by the average driver in each state. This process involved dividing the total amount of motor fuel used in each state by the number of licensed drivers.
ConsumerAffairs also examined commute mode share, National Transit Database tables on passenger trips and fuel tax rates by state, as well as other resources from the United States Census Bureau, Federal Transit Administration, U.S. Energy Information Administration, American Public Transportation Association, U.S. Department of Energy, Institute for Transportation & Development Policy and Amtrak.
The FHWA and the FTA include data estimates for instances in which state- and local-level figures were not made available.
This story was produced by ConsumerAffairs and reviewed and distributed by Stacker Media.


